 |
ANSI C UA Server SDK
1.5.3.333
|
|
ANSI C UA Server SDK
1.5.3.333
|
This section describes how to use Wireshark for OPC UA protocol analyzing.
First you need to install Wireshark. The source code as well as binary installers for Windows and Mac OS X are available at http://www.wireshark.org/download.html.
To use Wireshark, follow these steps:
If you now start your OPC UA Server and connect with your Client, you will capture all service calls on the network. After performing the actions you want to capture, stop the Wireshark capturing. You can now set “Display Filters” to reduce the view and all the captured information.
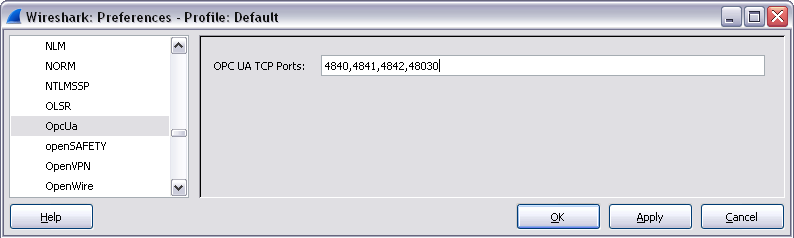
First set the OPC UA ports you want to capture by setting the Wireshark Preferences. Choose “Edit” → “Preferences” from the menu. Select “Protocols” from the tree and scroll down to OpcUa. Enter all the ports you need separated by a comma (see screenshot) and confirm with “Apply”.
Click on “Capture Options” in the main window.
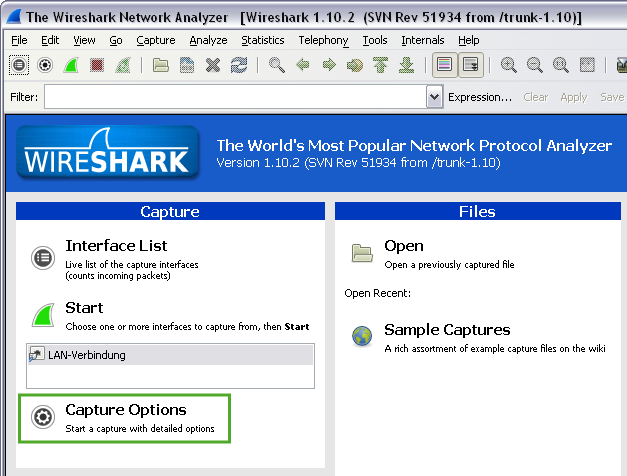
If necessary, select the network interface for capturing.
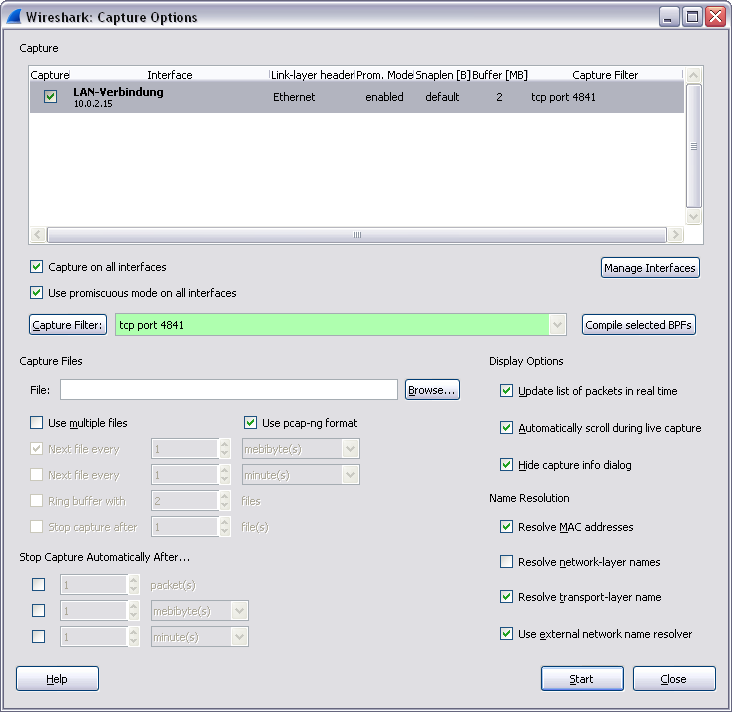
To reduce the amount of data collected, set a capture filter to “tcp” or a specific port, e.g. “tcp port 4841” (see screenshot), and start capturing by clicking on “Start”. Then perform the actions you want to capture.
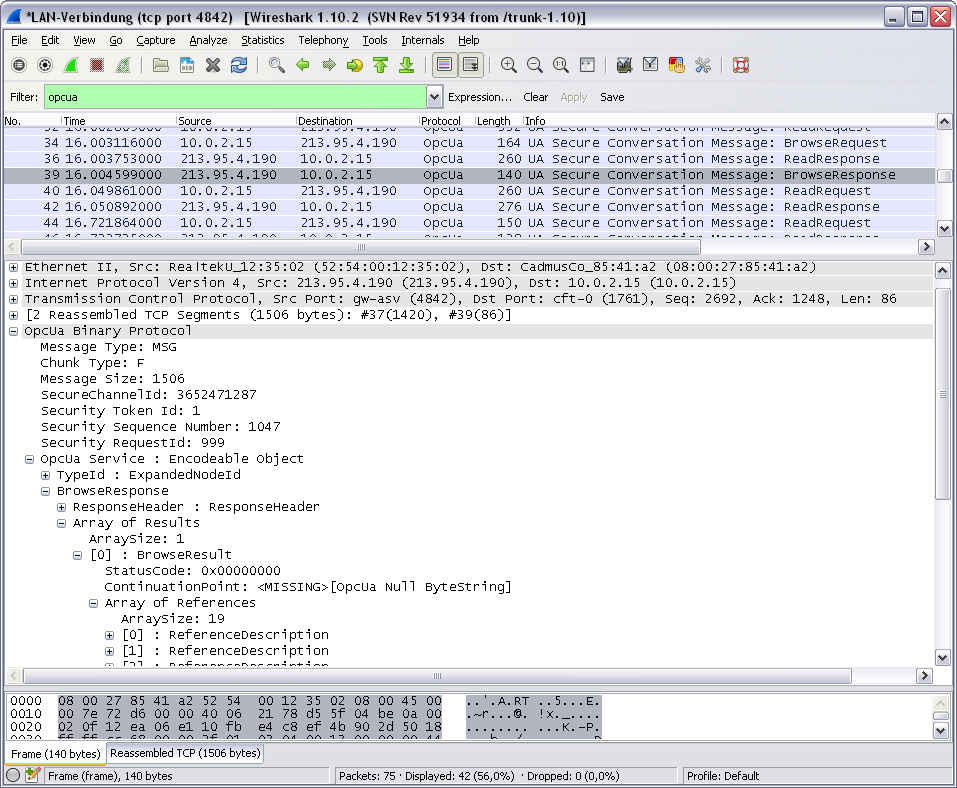
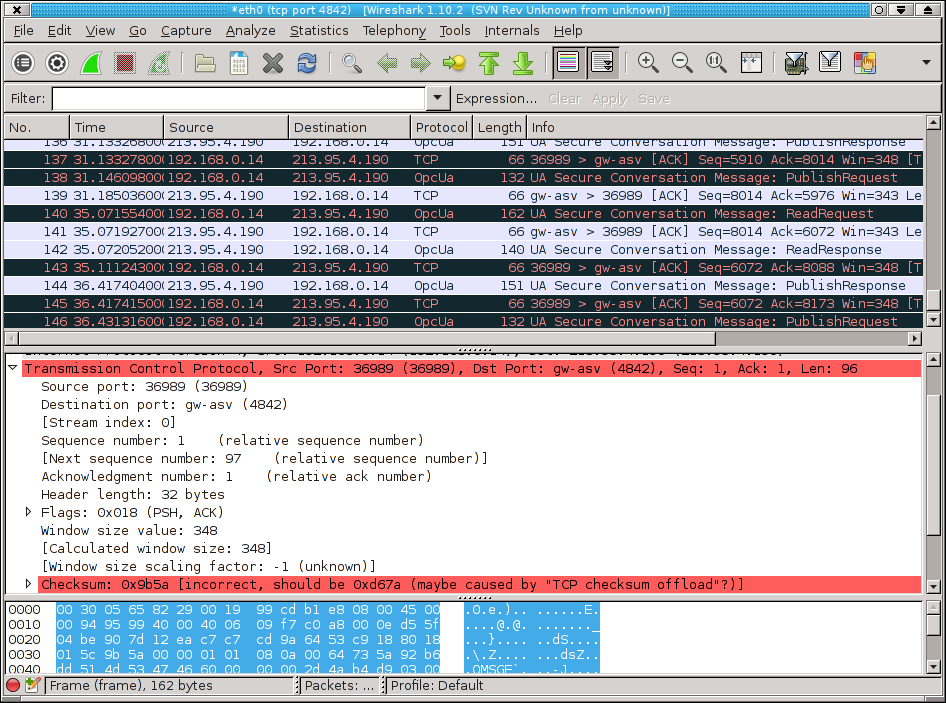
The result is displayed in the main window having three horizontal sections. The first upper section shows the individual telegram including timestamp and direction (source to destination). To show only OPC UA related packages, enter “opcua” at “Filter”. On selecting a certain message its content is expanded in the window below. In the example you can see a response sent from the server to the client that was returned on a call of the Browse Service. The content of all objects can be decoded. In addition, the lowest window pane shows the hexadecimal view for the selected item.
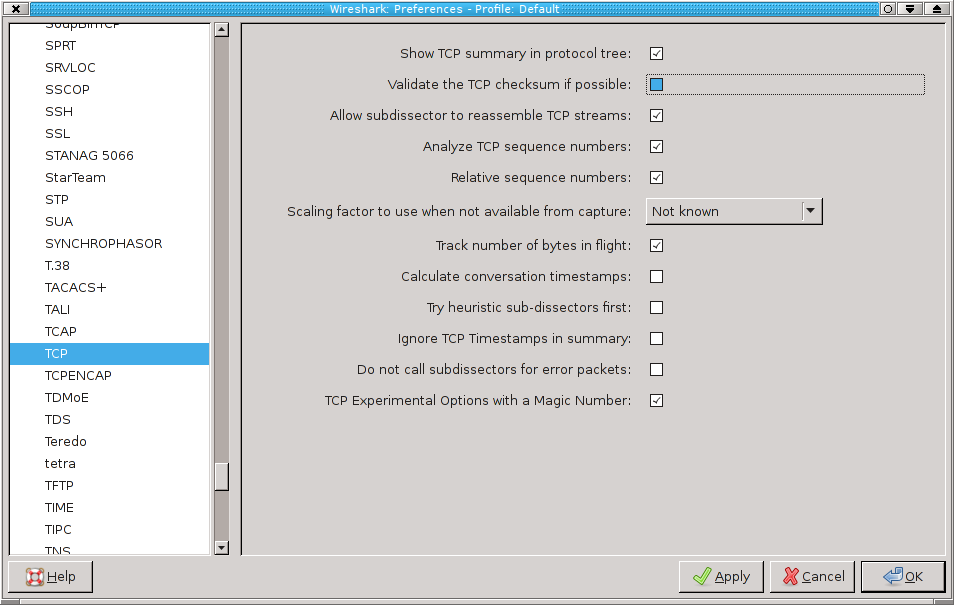
When using a newer network interface card, you may notice a lot of checksum errors while capturing (see the following screenshot) caused by TCP checksum offloading (see the Wireshark wiki for more information).
To suppress these errors, you have to disable TCP checksum validation. Choose “Edit” → “Preferences” from the menu, select “Protocols” → “TCP” from the tree and uncheck the box at “Validate the TCP checksum if possible” (see screenshot).
The SDK comes with a built-in tracing mechanism. Enabling the trace and setting the trace level is possible when initializing the UA stack. The OpcUa_ProxyStubConfiguration structure passed into UaBase_Module_InitializeUaStack offers parameters that modify the trace:
In your code you can also trace into the SDK trace by including <opcua_trace.h> and calling OpcUa_Trace, e.g.:
When running the included Visual Studio examples for ANSI C SDK Demo Server and Oversampling Example in debug mode, the following window shows up:
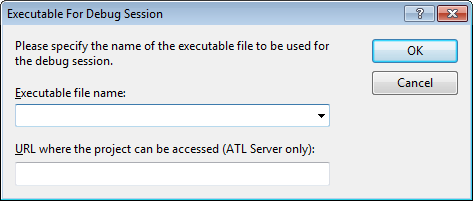
This is caused by a limitation of Visual Studio which prevents us from including all required settings in the Visual Studio solution. Unfortunately, it is necessary for you to perform two settings before you can use the included projects.
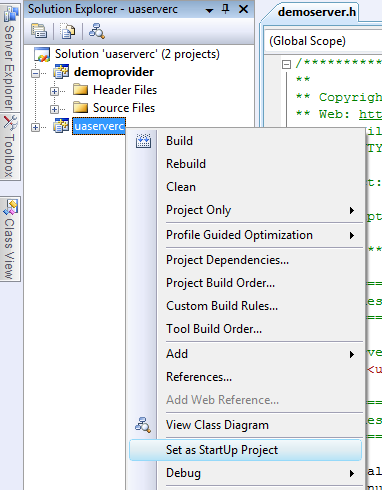
By default, Visual Studio sets the first project in a solution as StartUp Project, which happens to be the wrong project in both of the included solutions. To work as expected, the following StartUp Projects have to be set:
This is exemplarily shown in the following screenshot for the Demo Server Project: Right-click on the project uaserverc and select Set as StartUp Project from the context menu.
By default, Visual Studio sets the directory containing the project file as working directory. This has to be changed to the output directory.
Right-click on the StartUp Project (see above) and select Properties from the context menu. Fill in the following value: $(TargetDir)
The servers should now start up properly in debug mode.

