 |
UaExpert
1.6.2 438
|
|
UaExpert
1.6.2 438
|
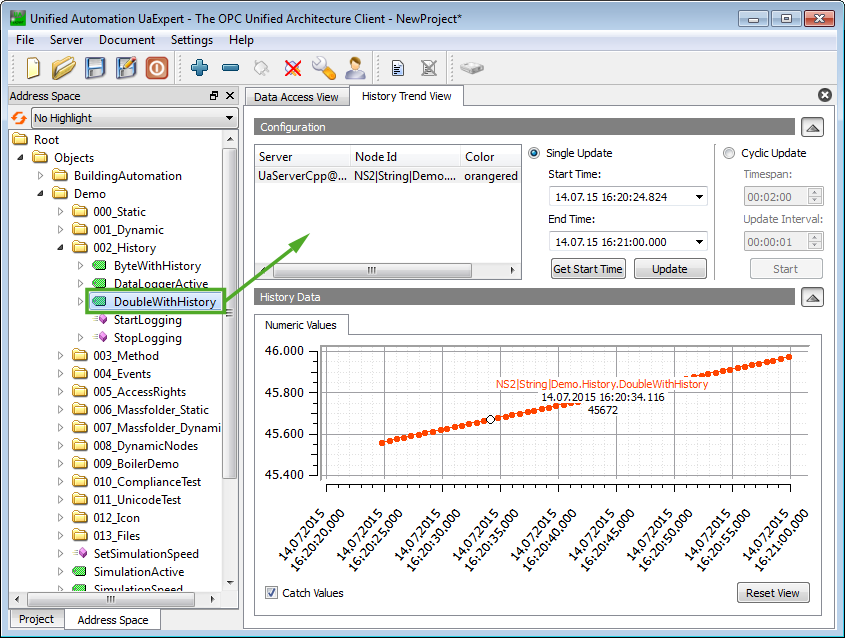
The History Trend View can be used for obtaining historical data for one or more OPC UA Nodes. The received values are displayed in a graphical trend view.
Select a node containing historical data in the Address Space Window and drag and drop it to the configuration section in the History Trend View (see screenshot). There are two ways to configure the time interval for displaying historical data.
Move the mouse pointer on a certain data point in the graph to display the timestamp and the value.
Double-clicking on the color in the configuration table opens a drop-down menu to select another color to display the data values in the graph.